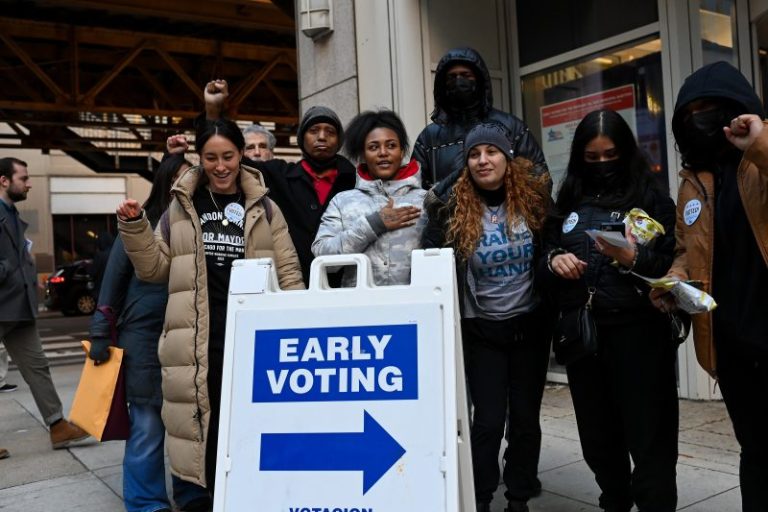
When the Census Bureau released data earlier this month on the demographics of the electorate in last year’s midterms, it contained a bit of information that ran counter to the post-election narrative: Turnout among the youngest voters was not substantially larger than in the 2018 midterms, much less the 2020 presidential contest.
I was therefore intrigued when, reading the voter-data firm Catalist’s assessment of the midterms, I came across this top-line assertion: “Gen Z and Millennial voters had exceptional levels of turnout.”
As it happens, both are true. Turnout among younger voters was relatively flat — but millennials in particular are no longer younger voters. And as the oldest Americans age out of the electorate through unhappy natural means, more of the electorate is made up of younger voters.
Younger, more heavily Democratic voters.
It’s important to segment out two distinctions.
The first, as above, is the divide between age and generation. For the latter, I (and most people at this point) use the Pew Research Center’s delineations of where generational groups begin and end.
The other distinction is between turnout and percent of the electorate. The former indicates how many eligible voters in a population cast a vote. The latter indicates how much of the actual electorate that population comprises.
There’s a standard pattern to voter turnout that’s captured by the Census Bureau. The youngest voters tend to turn out at decent rates before the percentage drops off. Over time, as voters get into the habit of voting and, probably more importantly, have more stable careers and housing, turnout ticks upward. Until, again, that natural denouement.
Here’s what the pattern looked like in 2016 and 2022. (I’ll note that these numbers are not adjusted for nonresponse, but it doesn’t really matter in this case.)
Why that big surge in the 18 to 24 range? In part because these are new voters, encouraged to vote by their high schools and colleges. It also corresponds to how ages align with elections: someone who turns 18 in a presidential election year is more likely to vote that year than someone who turns 19 in a midterm year.
Now let’s transition the graph above from age to generation. Now the two lines look like this.
Notice that the youngest voters, those in Gen Z (born from 1997 to 2012), entered that second peak in turnout that occurs around age 24. Millennials (born 1981-96), though, sank into the mid-20s to early 40s valley.
More importantly, notice that the generations now stretch from 18-year-olds to 41-year-olds — a much bigger chunk of the population than they were in 2016 (18- to 35-year-olds).
Catalist’s analysis shows that Gen Z and millennials made up 23 percent of the electorate in the 2018 midterms and 26 percent last year. Gen X (born 1965-80), middle-aged people (sigh) who are steadily voting more heavily, saw their percentage of the electorate increase, too. The group that dropped off was, predictably, the oldest voters.
That comports with analysis of the 2016 to 2020 elections by Pew. It found that between 2016 and 2020, the oldest generations comprised half as much of the electorate, with the difference made up by those in the Gen Z and millennial groups.
For a lot of reasons, this has been on people’s radar for a long time. Those reasons include an understanding of how the concept of “age” works. But another is that the propensity of younger voters to vote much more heavily Democratic has been an alarm bell ringing at the Republican National Committee since at least 2012.
The graph below shows how Pew and Catalist track the shift in both percentage of the electorate (left to right) and support for Democrats (bottom to top) in 2016, 2018, 2020 and 2022. You can see that older Americans and members of the silent generation (born 1928-45) make up less of the electorate. The ever-hefty baby boom generation (born 1946-64) continues to make up a plurality of voters. But millennial and Gen Z voters, who consistently back Democrats by wide margins, are matching or (in 2020) passing Gen X.
At this point, the GOP is bolstered primarily by its relatively small advantage among baby boomers both in terms of support and heft in the electorate. But that’s changing. (Obligatory plug for my book on this subject and what follows.)
What the data above suggests — what the pattern undergirding that data suggests — is that the shift to the left that has been expected as younger generations make up more of the electorate is a central reason that Democrats did better than expected last year. The natural question that follows, then, is what happens now.
One important component of this divide between older and younger Americans is that younger Americans are much more heavily non-White. The Census Bureau’s data on age and race released halfway between the 2016 and 2022 elections shows that distinction: The most common age for White Americans in 2018 was 58. The most common age for non-Whites was 27.
That’s the question that keeps the GOP up at night: Can it expand its appeal among Black, Hispanic and Asian Americans?
The Catalist data suggests that Democrats got about 6 in 10 Hispanic and 9 in 10 Black votes in 2022. But, remember, for every 72-year-old White American in 2016 who is turning 80 in 2024, there are 1.2 Black, Asian and Hispanic Americans who were 10 years old in 2016 and will be turning 18 next year.
It’s important to remember that these trends are unfolding slowly, with both parties having time to adjust and respond to them. But there’s no question that the long-expected shift away from the baby boom and older voters has been underway for some time. What Catalist’s analysis suggests is that this shift helped turn the Democrats’ 2022 from a bloodbath into a papercut.

